Why do I need to learn Data Analytics?
-
The ability to work with data and produce meaningful analysis that help with taking the right decision is becoming one of the most important skills for today work environment.
-
Python and its data science library named Pandas make this task simple and fun.
The process of Data Analytics
-
The process of data analysis is made of 7 key steps from deciding the objectives of your analysis to writing the final report and conclusion.
-
The time you spend at each step depends on the data that you working with.
-
Well organized and clean data require less time to be spent of cleaning and exploring the data.
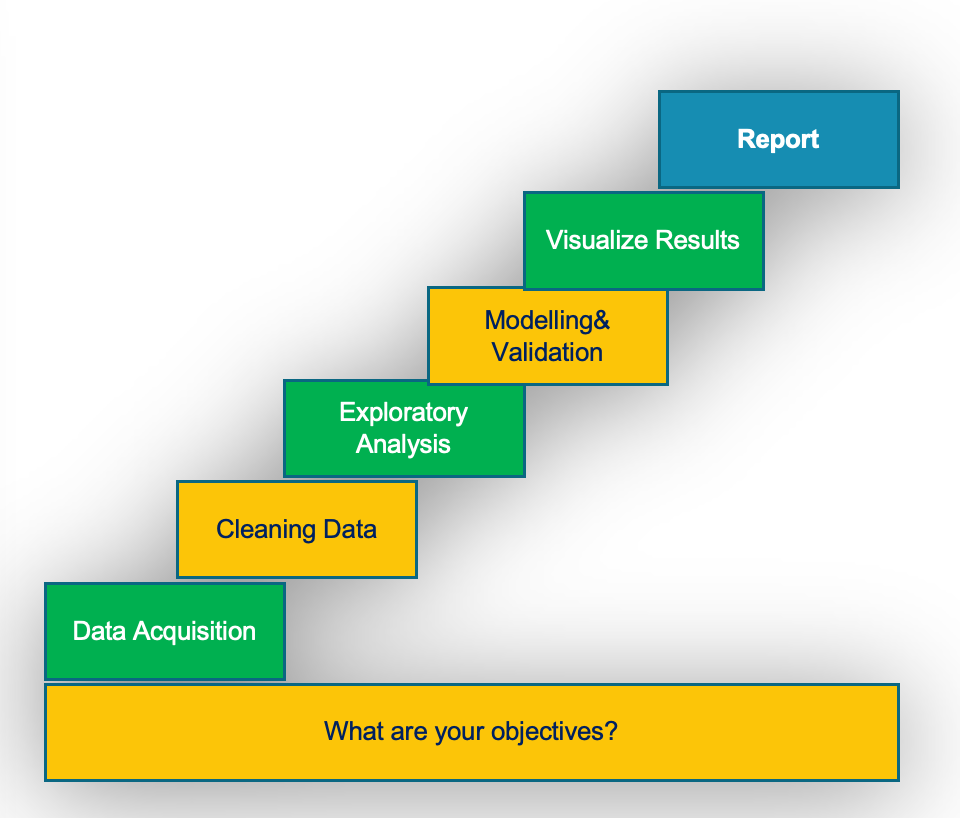
- What are your objectives?
- The first step in data analytics is deciding your objectives. What are you trying to achieve?
- Data Acquisition
-
Reading data from various sources including spreadsheet, comma separate file, web pages, database, etc.
-
Then you store the data in variables.
- Cleaning Data
- The raw data may contain unwanted data or missing data for some columns.
- In this process you remove unwanted data and fill missing data if possible.
- Exploratory Analysis
- The objective of this process is to get familiar with your data and summarize their main characteristics.
- Modeling and validation
- In this step you start building models of your data for the purpose of duplicating data analytics techniques.
- Advance tools such machine learning are used in this step, which will not be covered in this book.
- Visualizing Results
- Using various charts to visualize the data to help with decision making process.
- Report
- Writing the final report and key conclusions.
What is Pandas?
-
Pandas is an open source library providing high-performance, easy-to-use data structures and data analysis tools for the Python programming language.
-
It provides fast, flexible, and expressive data structures designed to make working with data easy and intuitive.
-
Pandas allows data users to work with high-level building blocks for doing practical, real world data analysis in Python.
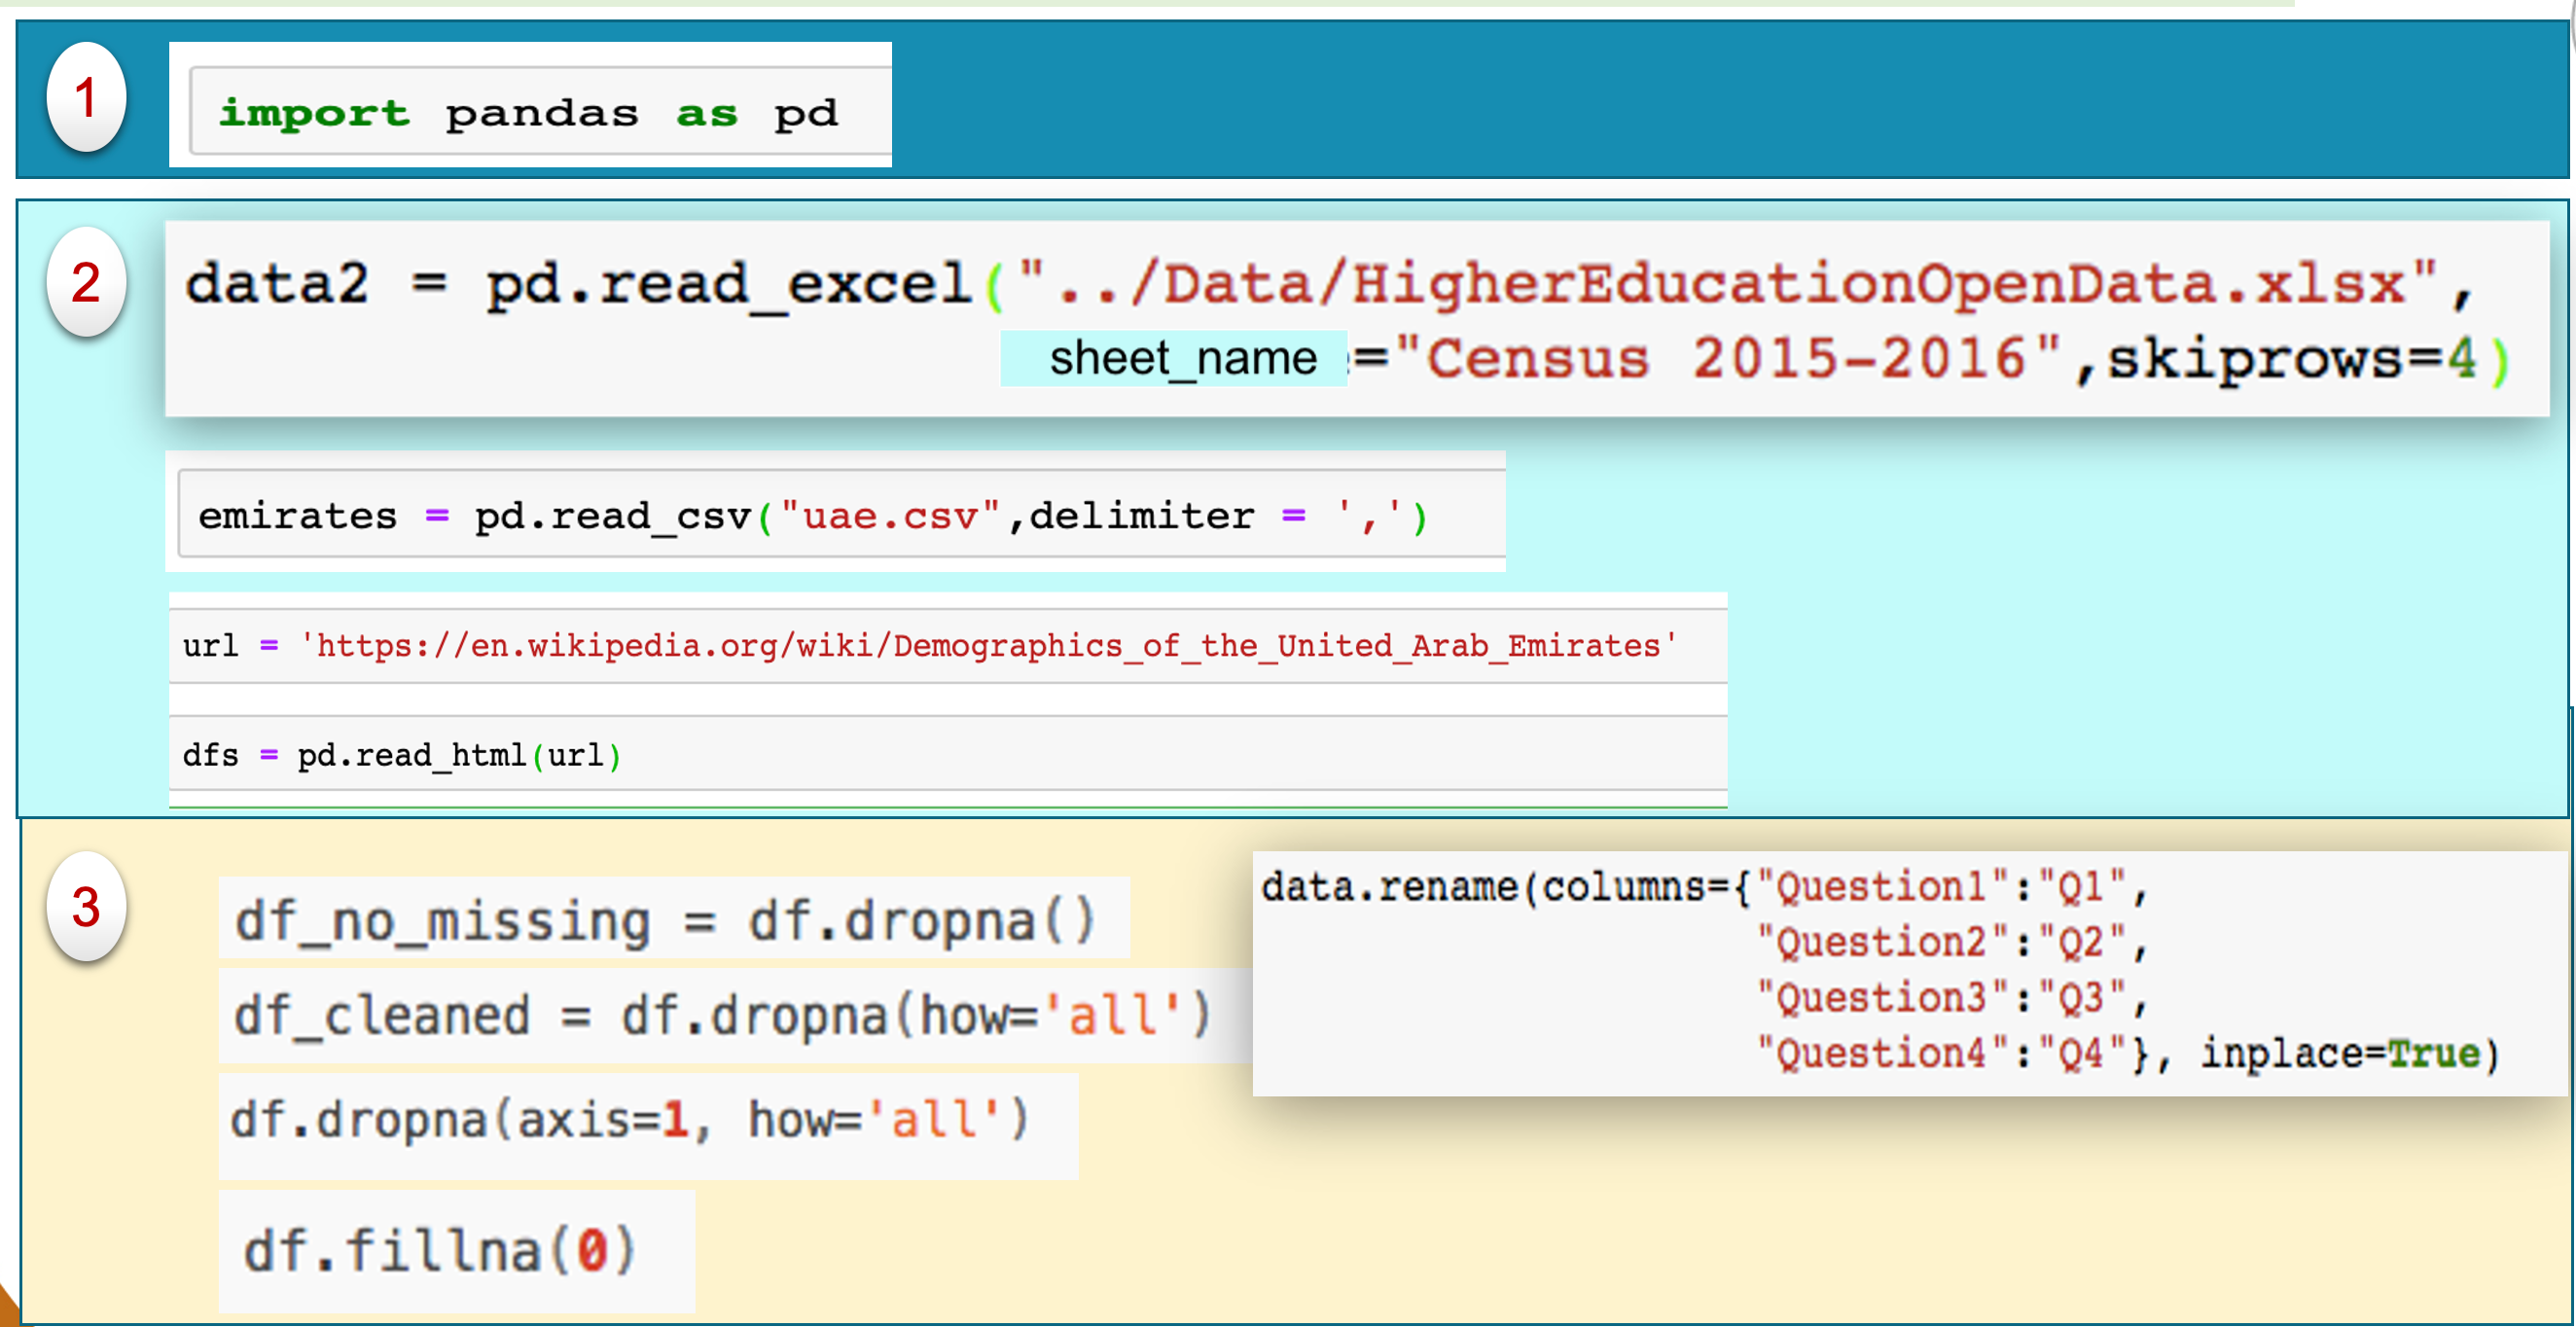
Importing Pandas to Python
Similar to importing turtle library, the following line imports pandas and creates a pandas object with the name pd.
import pandas as pd
From now and on, you can use the object pd to perform pandas operations.

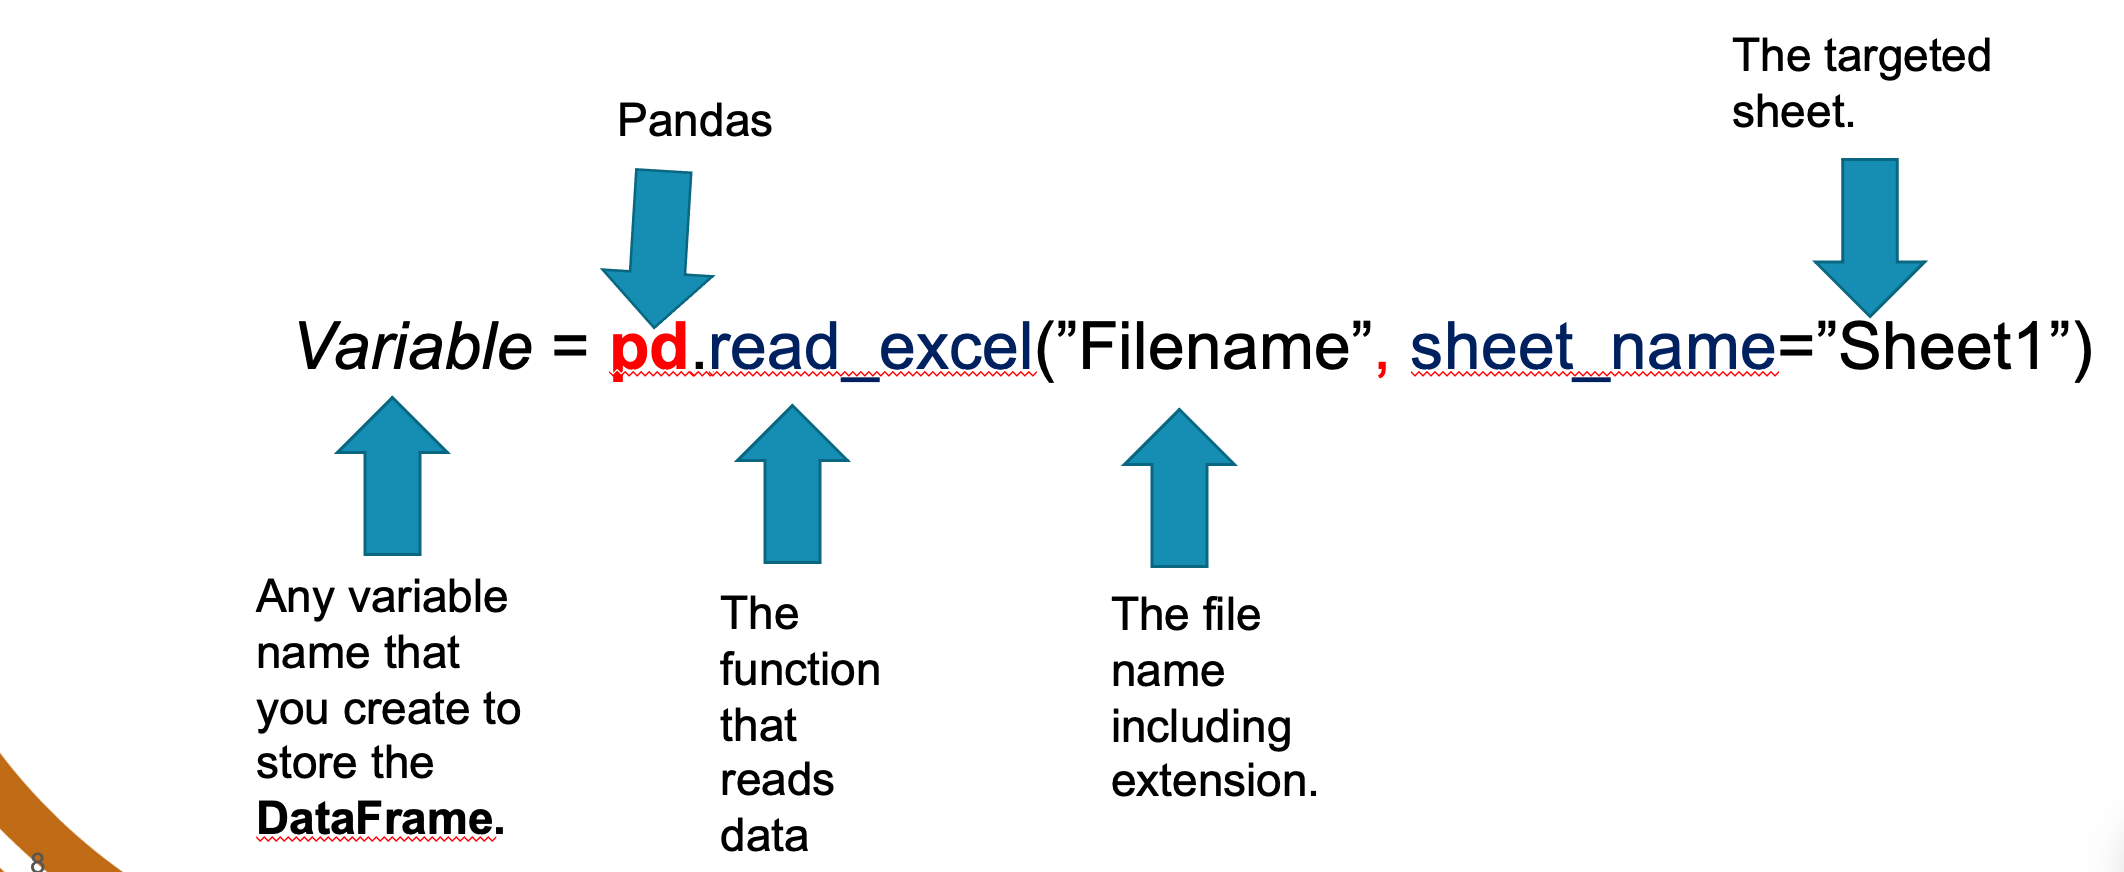
Data Acquisition: 1. Read data from Excel file
ndas allows you to access various sources of data including Excel, Comma Separated Values (CSV), tables, text, database, web and more.
The general syntax to read data from excel file is as follows:
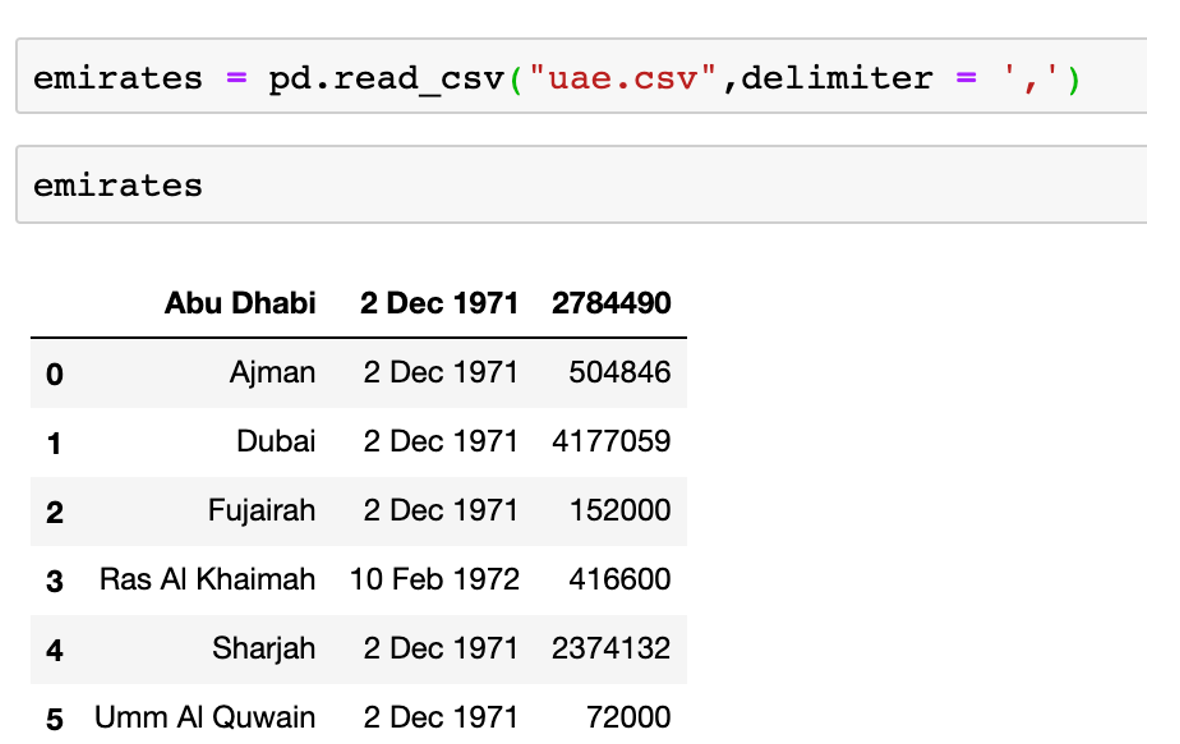
Data Acquisition: 2. Read data from CSV file.
Read data from a flat file - Comma Separated Values (CSV).
Variable = pd.read_csv("Filename.csv", delimiter=",")
Example
Using the data below:
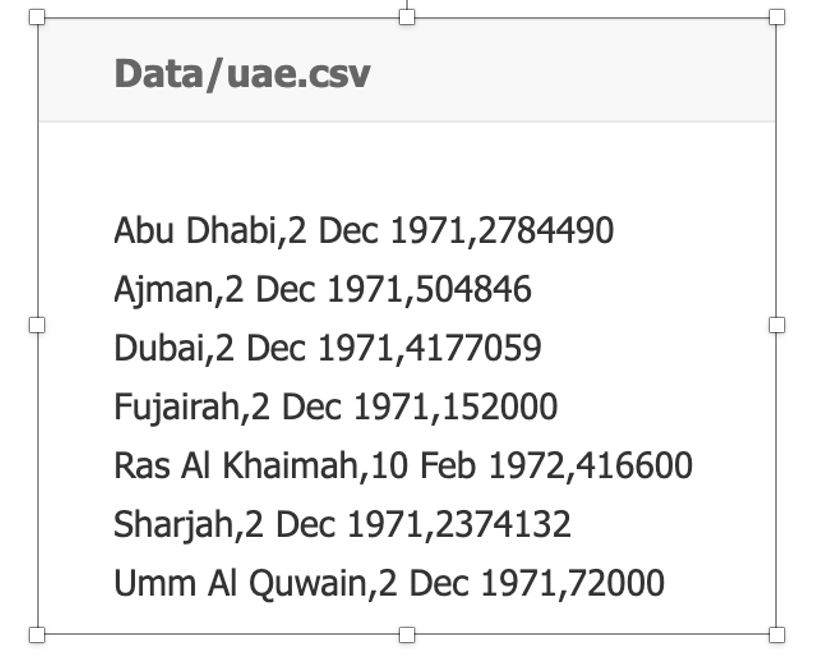
Now, the following command will read the data file and display the content in a partcular format:
	from google.colab import files
        uploaded = files.upload()
        import pandas as pd
        emirates = pd.read_csv("uae.csv",delimiter=',')
        emirates
Data Acquisition: 3. Read data from Web page (HTML).
Read data from a web page
Variable = pd.read_html("url")
Note:read_html returns a list of DataFrame objects
Using the webpage content below:
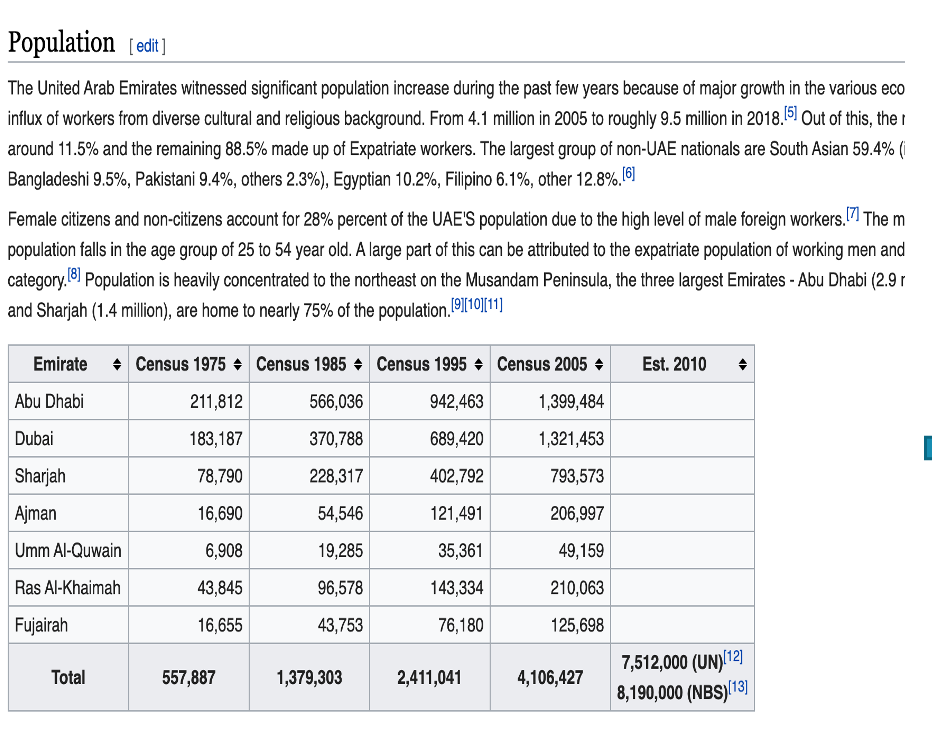
Now, the following command will read the webpage and display the content in a partcular format:
	import pandas as pd
        url = 'https://en.wikipedia.org/wiki/Demographics_of_the_United_Arab_Emirates'
        dfs = pd.read_html(url)
        dfs[3]
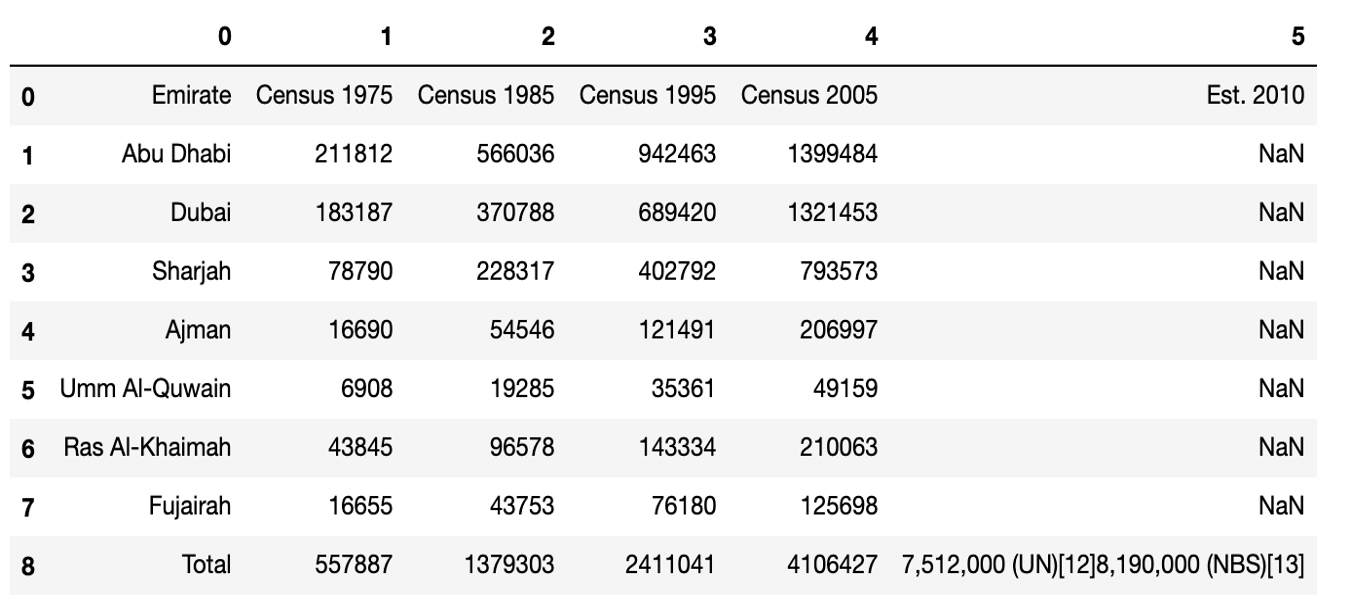
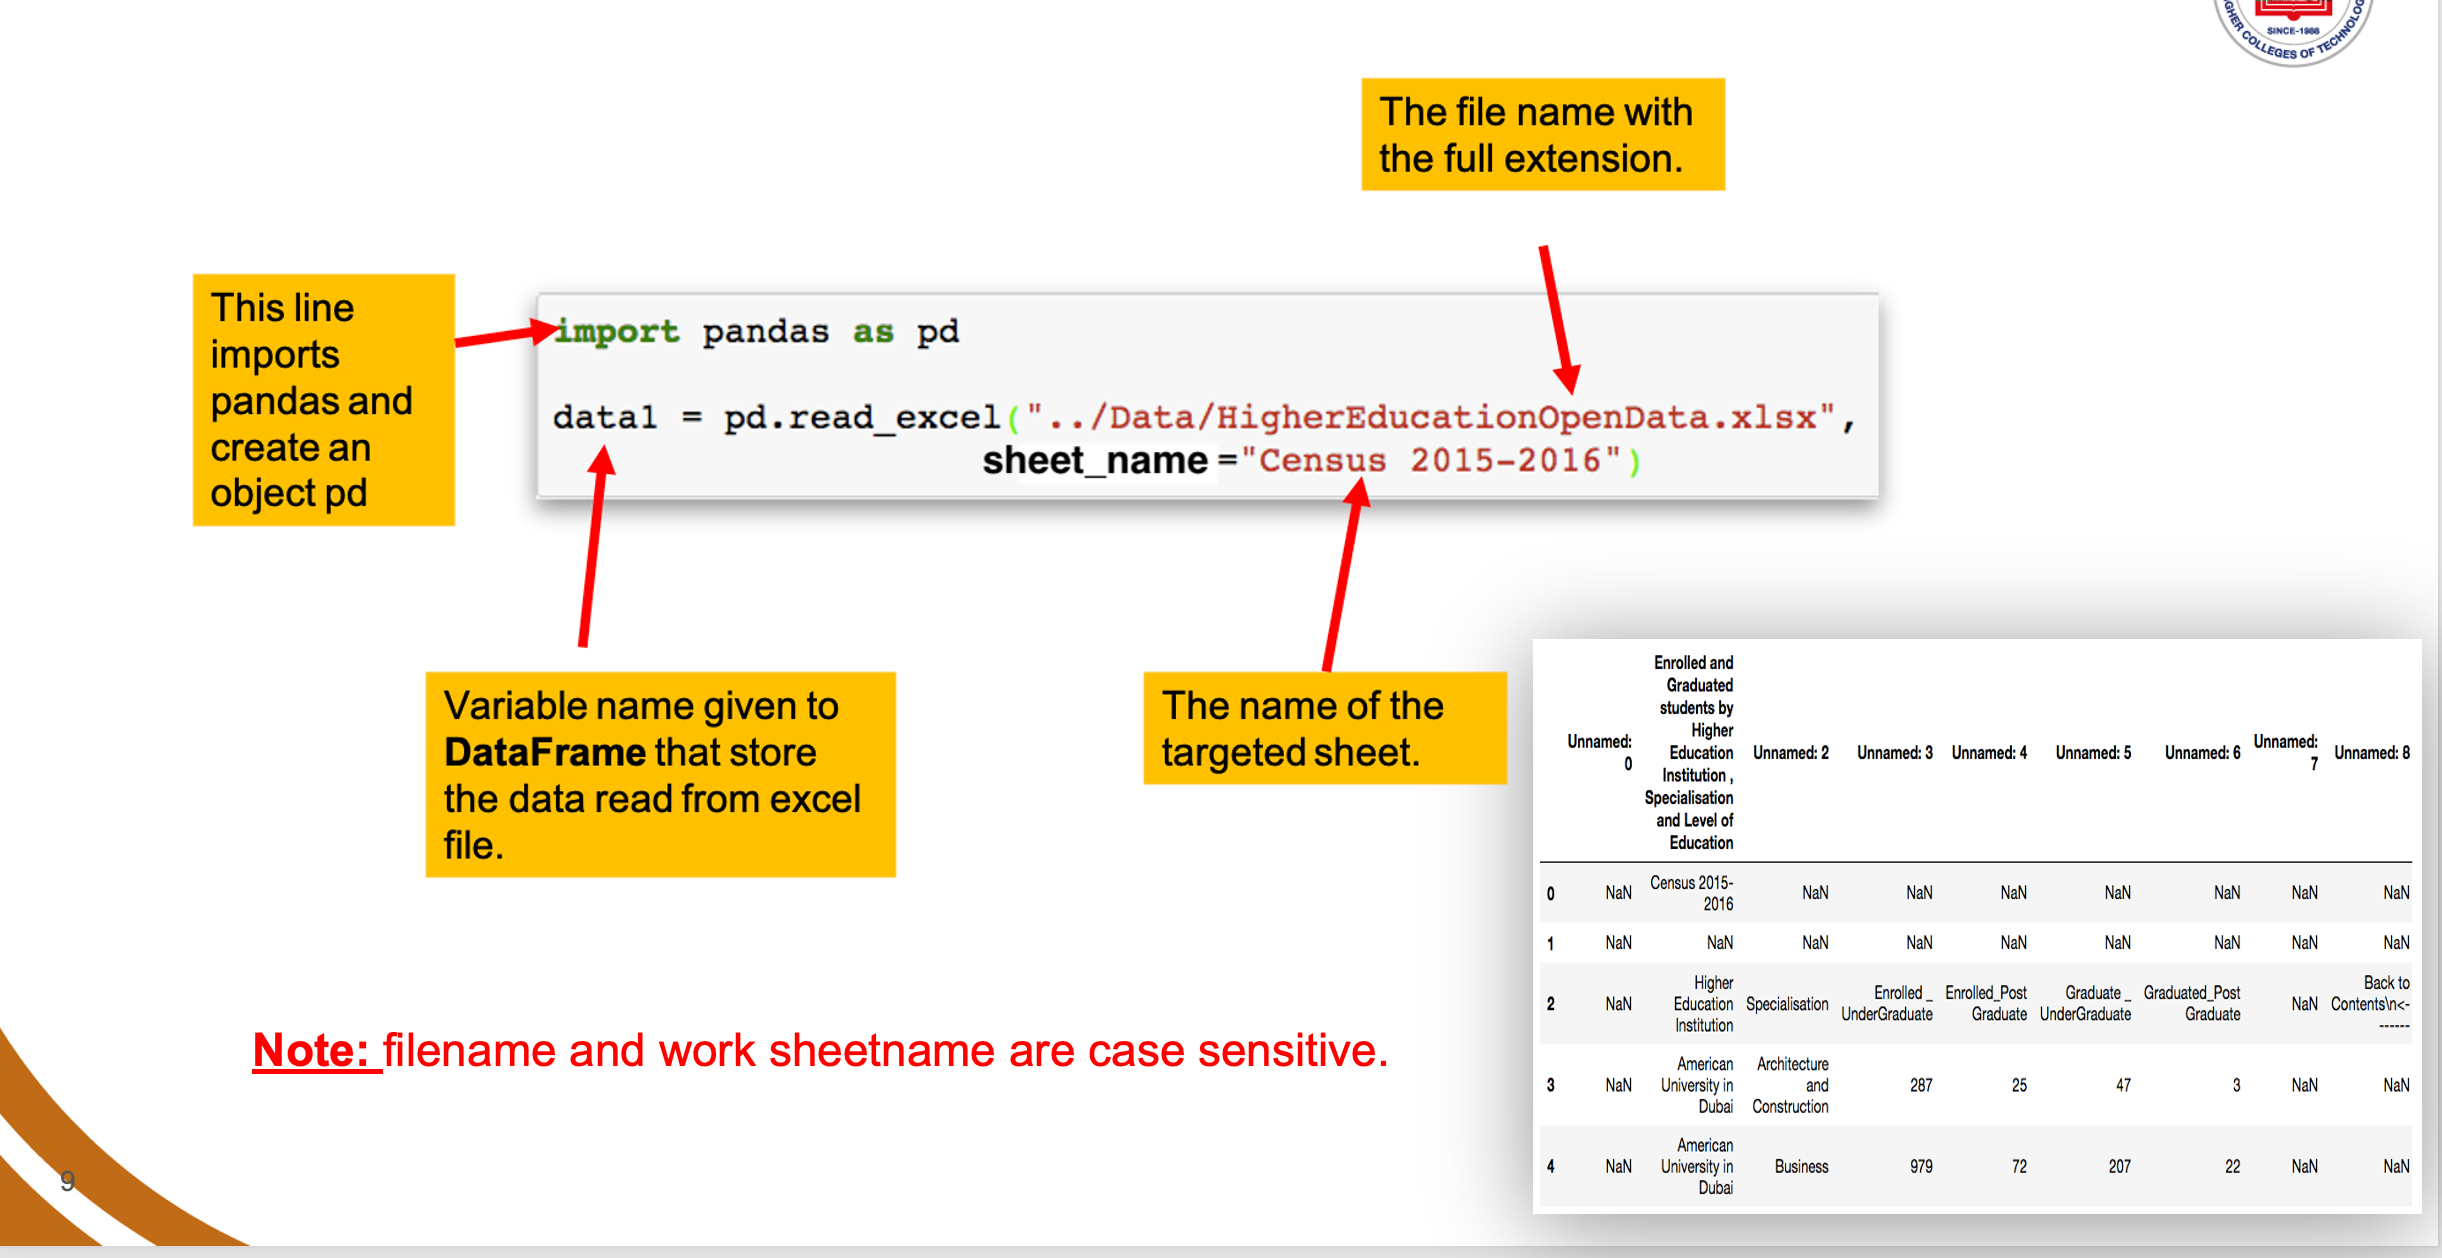
Pandas Data Frame
DataFrame: DataFrame is a two (or more) dimensional data structure – basically a table with rows and columns. The columns have names and the rows have indexes.
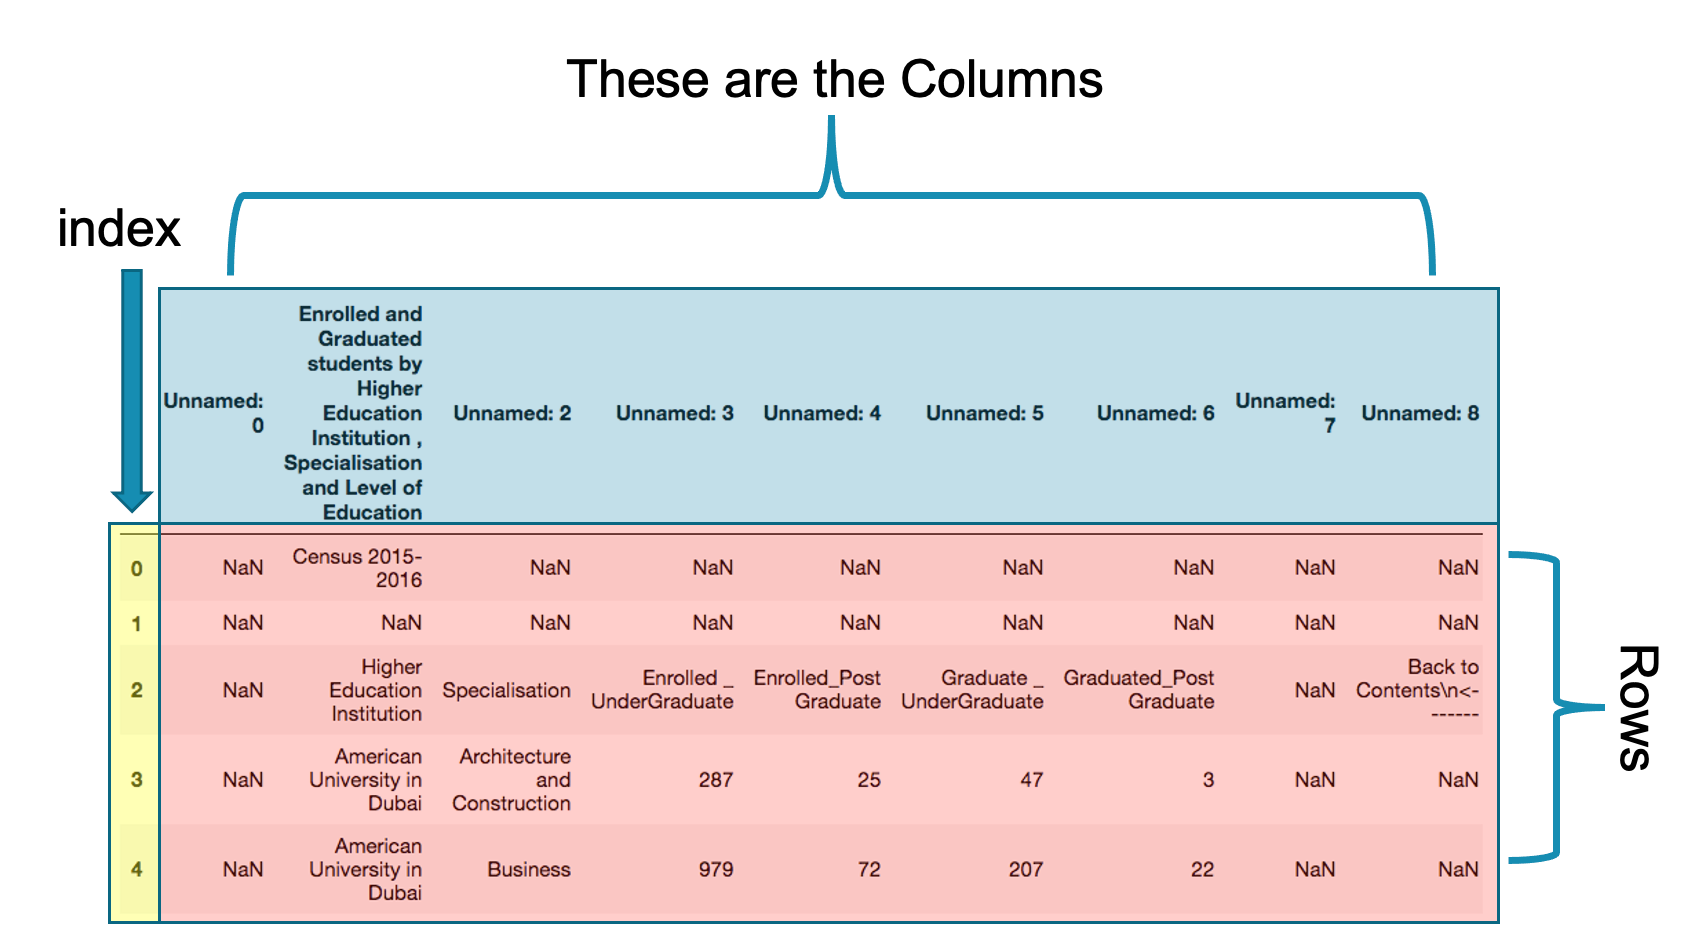
Let us examine the pandas data frame in more detail.
-
Index:The index is column zero in the data frame. The default index is integer number from 0 to the length-1 of the data frame. Index is used to speed up searching large data. Later we will learn how to change the index of a data frame.
-
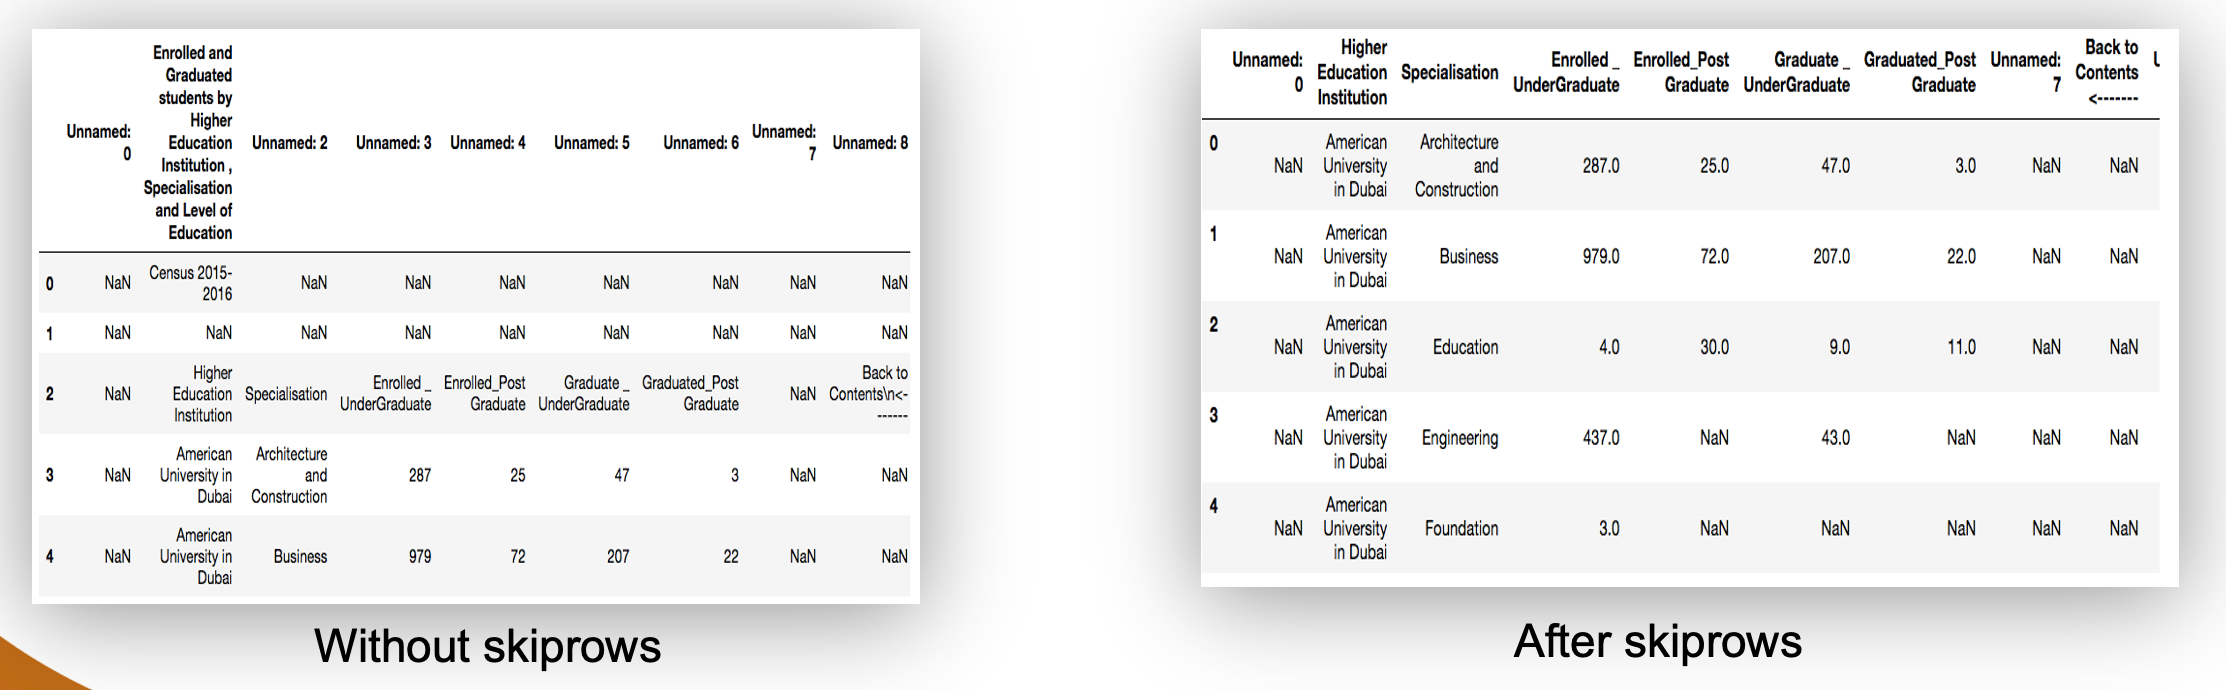
Columns:These are the names of the columns as in the original excel data. My looking carefully at these columns, we will note that they are not the appropriate columns for the data set. The correct column names are in the third row. To get the correct columns we need to skip the first 4 rows. We will learn later how to rename columns and create new columns.
-
Rows:Rows are the actual data excluding columns and index. You may noticed that there are number of cells with data NaN. These are the missing or not available data from our data source. Later we will learn how to deal which such missing data.
Data Cleaning: 1. Skipping unnecessary rows and columns
Pandas allows you to skip unwanted rows when reading the data.
data2 = pd.read_excel("../Data/HigherEducationOpenData.xlsx",sheetname="2015 − 2016",skiprows=4)
We basically added comma then skiprows=4 to the original line that reads data from the excel file. Store the result in a new data frame as data2.
Data Cleaning: 2. Working with missing data
In many cases you will find your self dealing with missing data. This is indicated by NaN in the cells or just empty cell. How to deal with such situation.
- Drop missing observations. This will delete all rows that contain any missing data: df_no_missing = df.dropna()
-
Drop rows where all cells in that row is NA.
This will delete rows that are missing all its data.
df_cleaned = df.dropna(how='all')
- Drop column if they only contain missing values
To force dropna to work on columns you need to add axis=1.
df.dropna(axis-1,how='all')
-
Fill in missing data with zeros
This will replace NaN with 0.
df.fillna(0)
Note:
keyword how="all" to indicate all cells have missing data
keyword how="any" to indicate any cell have missing data
Example: Filling in missing data
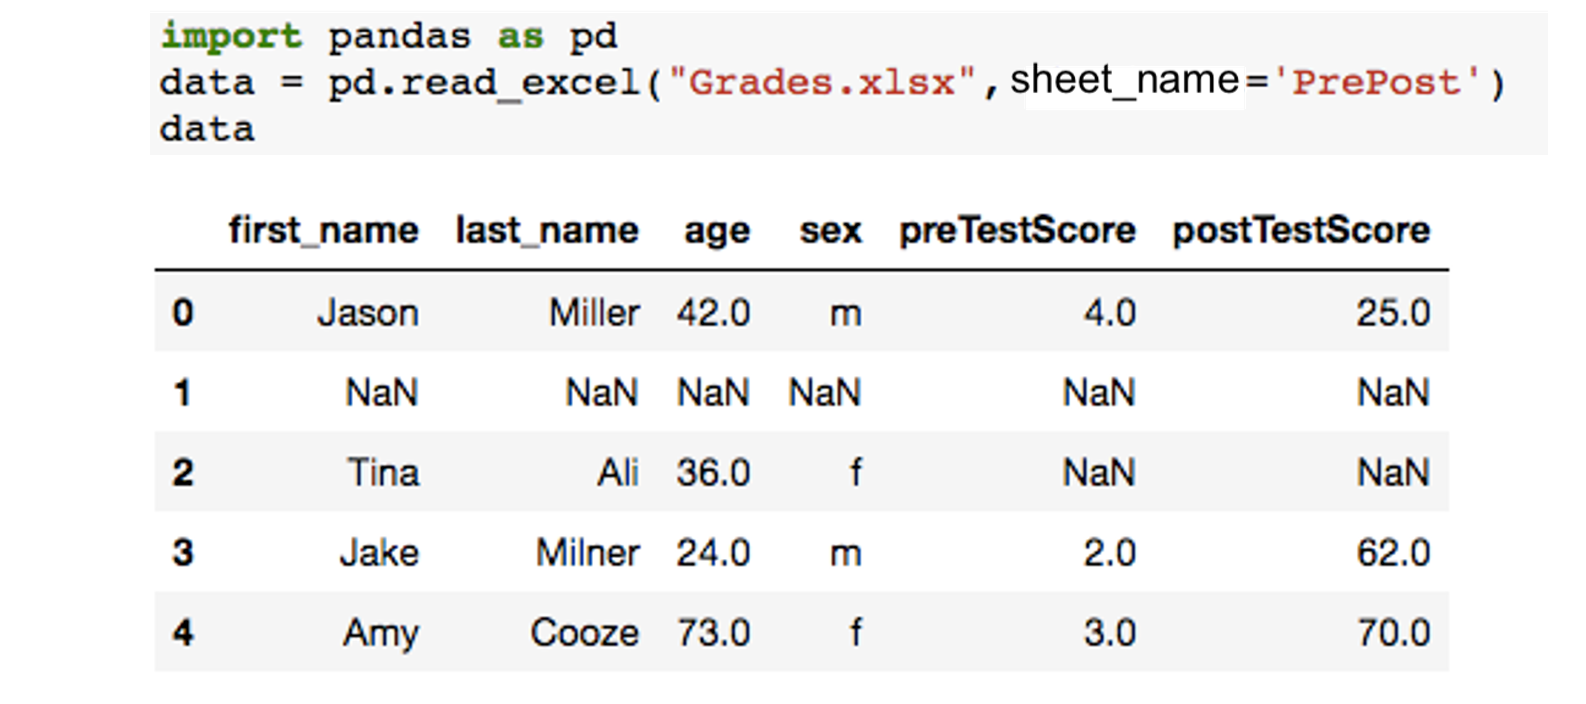
In this example we have a simple data set that contains students score pre and post test. The data set contains number of missing data of students who did not attend the exam. These missing data are appearing as NaN. Our simple task is to replace NaN with average (mean) score of the column.
The data set is included in the excel file "Grades.xlsx" that we used in the previous example. It located in the sheet "PrePost".
Here is the code needed to read the sheet.
	from google.colab import files
        uploaded = files.upload()
        import pandas as pd
        data = pd.read_excel("Grades.xlsx",sheet_name="PrePost")
        data
Fill all the missing values with 0 permanently using the below example.
    data.fillna(0, inplace = True)
    data
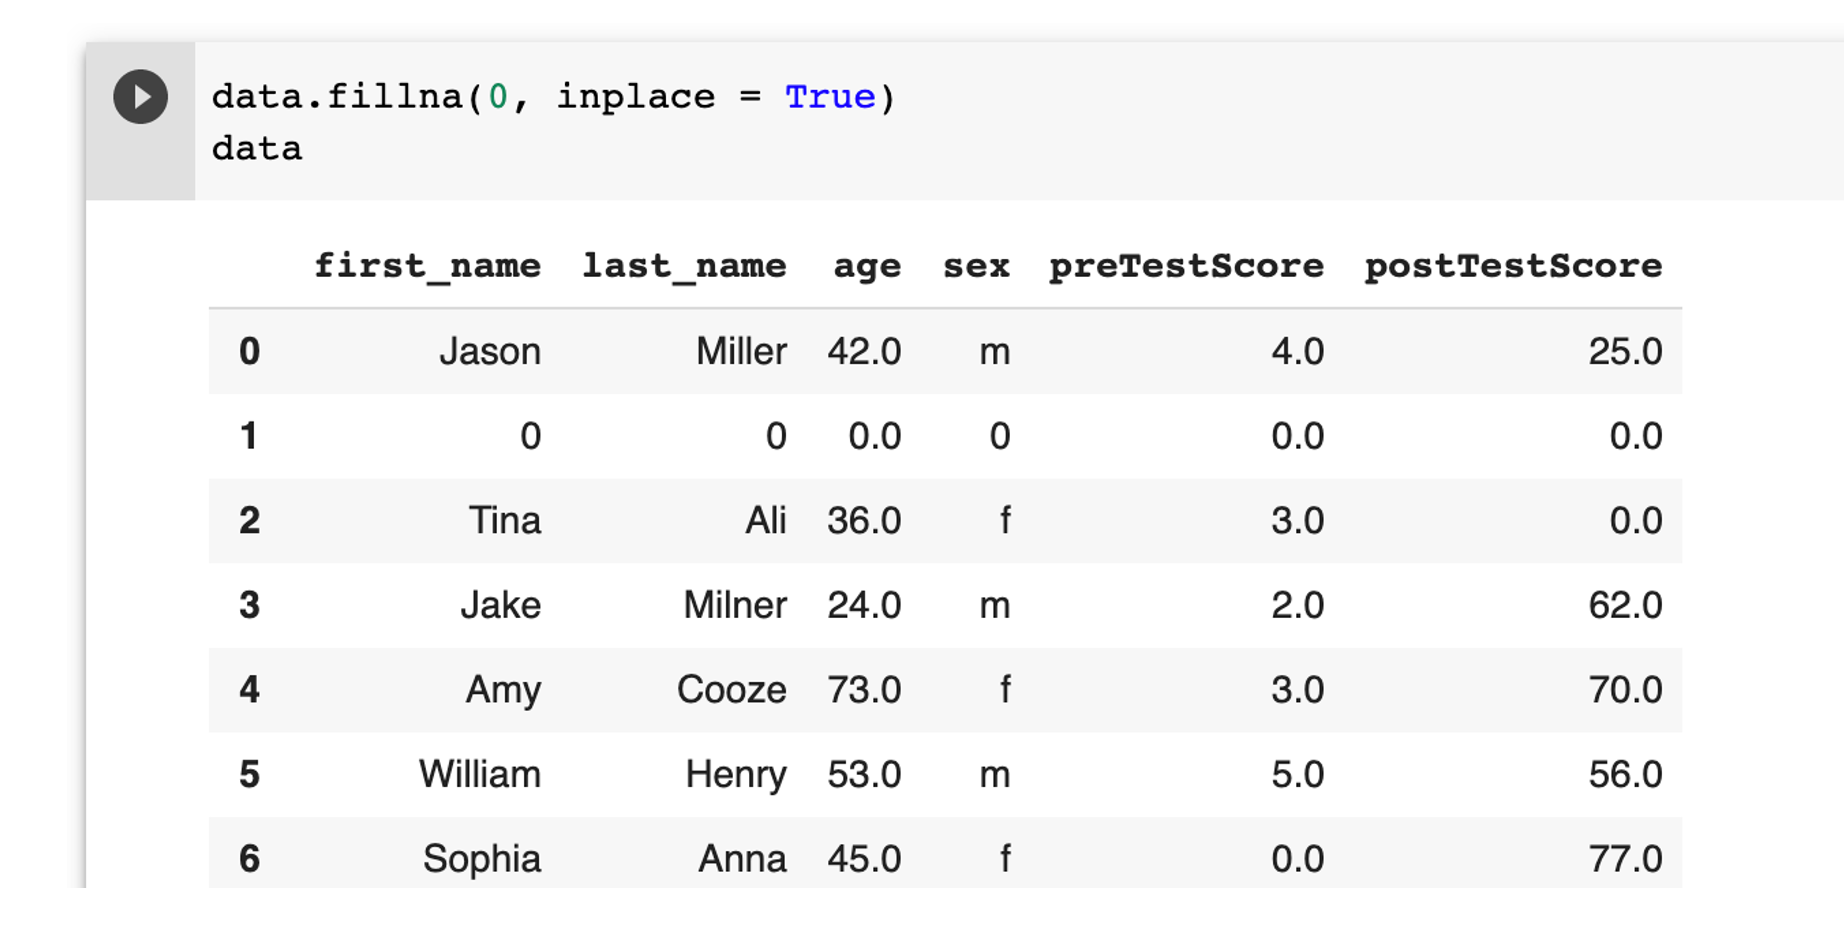
Note: use inplace = True to make the changes permenent.
Data Cleaning: 3. Renaming columns
When reading data from a data source you may get some columns with long or unappropriated names. Here you will learn how to rename a column.
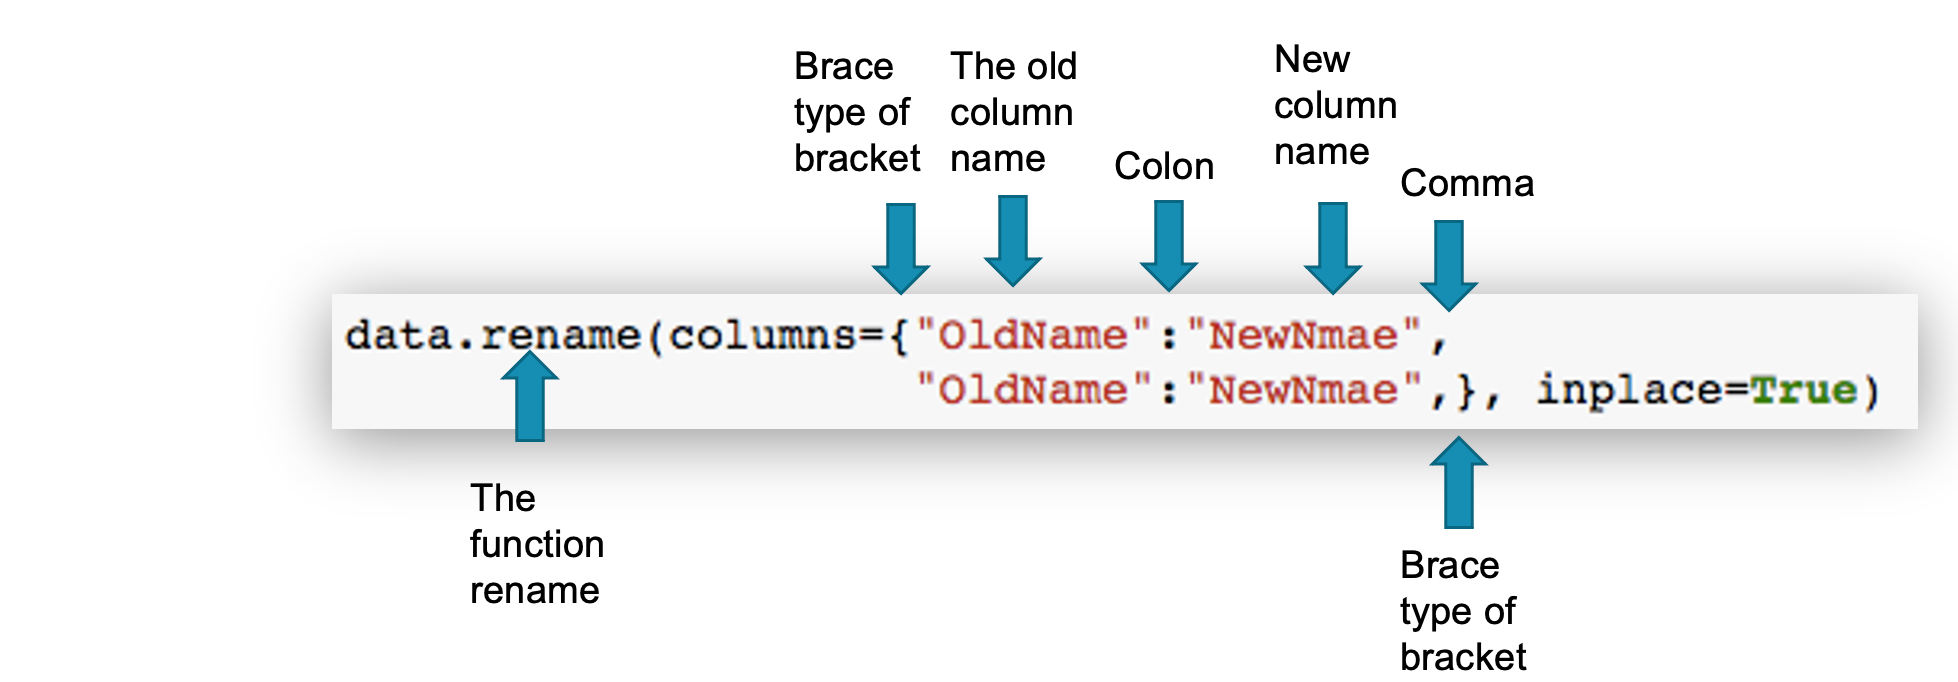
Note that inplace=True is needed to ensure that the changes you may are permanent. Otherwise, this line we display the new column name and if you try to access the same DataFrame, then you will get the old name.
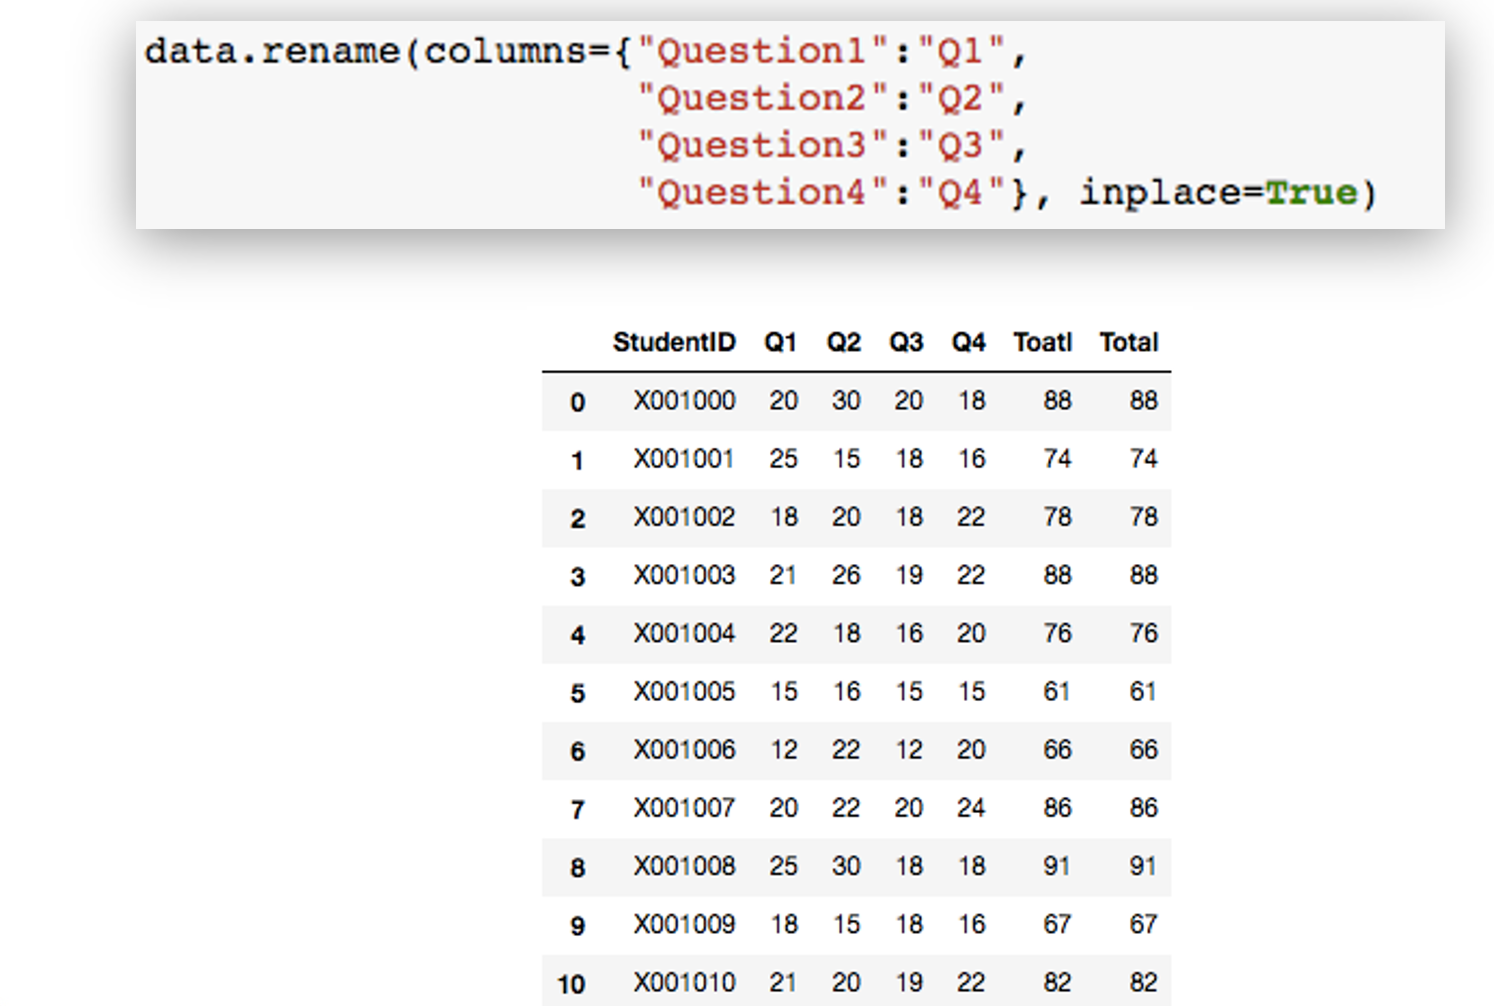
Example: Renaming columns
Following command will rename column Question1, Question2, Question3, and Question4 to Q1, Q2, Q3, Q4.
	data.rename(columns={"preTestScore":"preTest","postTestScore":"postTest"}, inplace = True)
        data
Summary Command
For more details, please contact me here.
Date of last modification: 2021